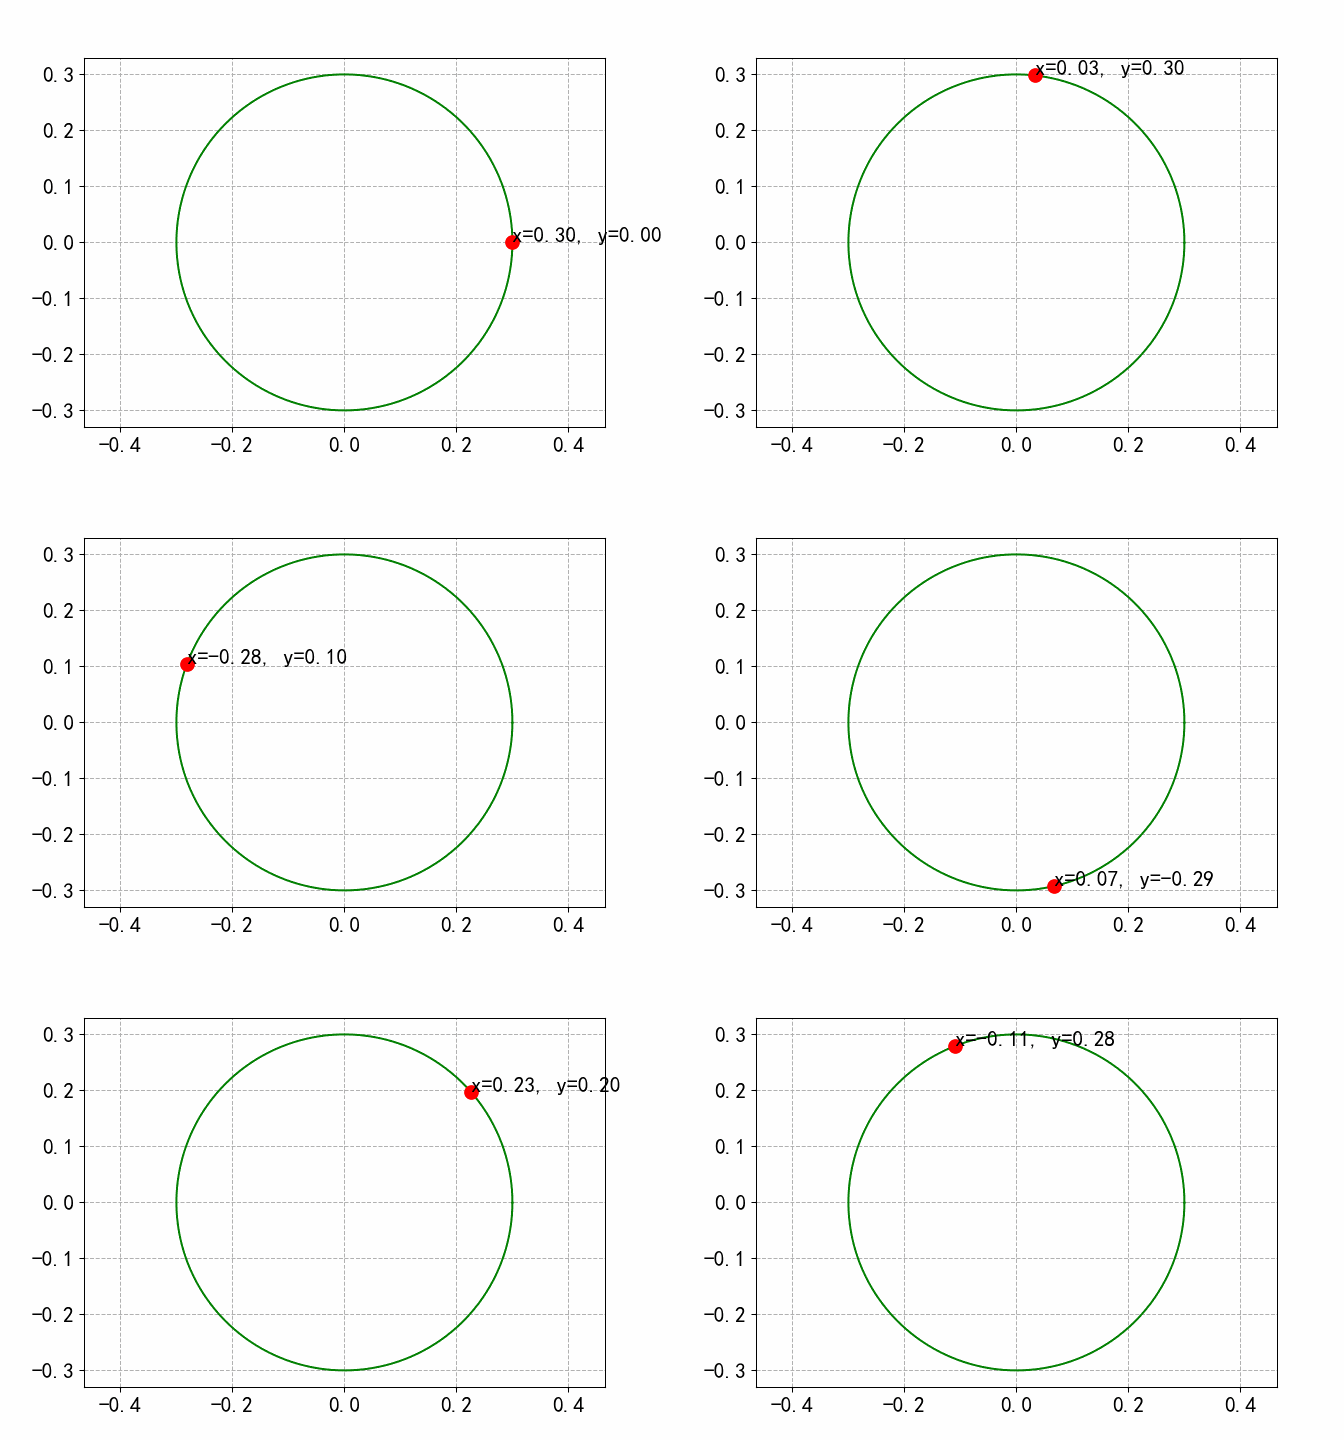
模拟小球在圆轨道运动 
Code
import math
from scipy.integrate import odeint
from sympy.abc import t
import numpy as np
import matplotlib.pyplot as plt
from matplotlib import animation

global g,r,tmax
g=9.8
r=0.3
tmax=10
#定义一个方程组(微分方程组)
def pfun(y,x):
    y1,y2=y; #让'y'成为一个[y1',y2']的向量 所以将等式左边都化为1阶微分是很重要的
    return np.array([y2,-g/r*math.cos(y1)]) #返回的是等式右边的值


global x,y,point_ani,text_pt,v0

v0 = 1*math.sqrt(3*g/r)
x=np.arange(0,tmax,0.02) #创建自变量序列
soli=odeint(pfun,[0.0,v0],x) #求数值解
plt.rc('font',size=16); plt.rc('font',family='SimHei')
plt.rc('axes', unicode_minus=False)

def update_points_v3(num):
    point_ani.set_data([x[num]], [y[num]]) ## point_ani.set_data(x[num], y[num]) 这种写法一直warning,需要传入列表等可迭代对象
    # point_ani.set_data(x[:num], y[:num])##显示轨迹
    point_ani.set_markersize(10)
    text_pt.set_position((x[num], y[num]))
    text_pt.set_text("x=%.2f, y=%.2f" % (x[num], y[num]))
    return point_ani, text_pt,
def toX(theta):
  return r*math.cos(theta)
def toY(theta):
  return r*math.sin(theta)
fig = plt.figure()
y=soli[:,0] #是角度
x=list(map(toX,y))
y=list(map(toY,y))
# plt.plot(x,y)#数值解
thetas = np.arange(0,2*math.pi,0.01)
plt.plot(r*np.cos(thetas),r*np.sin(thetas),'g',label="符号解曲线")
plt.axis("equal")##横轴纵轴等比例,防止出现不圆
point_ani, = plt.plot(x[0], y[0], "ro")
plt.grid(ls="--")
text_pt = plt.text(4, 0.8, '', fontsize=16)
ani = animation.FuncAnimation(fig, update_points_v3, np.arange(0, 200), interval=200, blit=True)
ani.save('cos_test3.gif', writer='pillow', fps=10)##imagemagick 不能用了

plt.legend()
# plt.show()
plt.close()